Bullish Reversal
Bullish Reversal
Bullish Reversal
Bullish Reversal
What Is the Bullish Harami Pattern and Its Significance?

Finosauras
Team
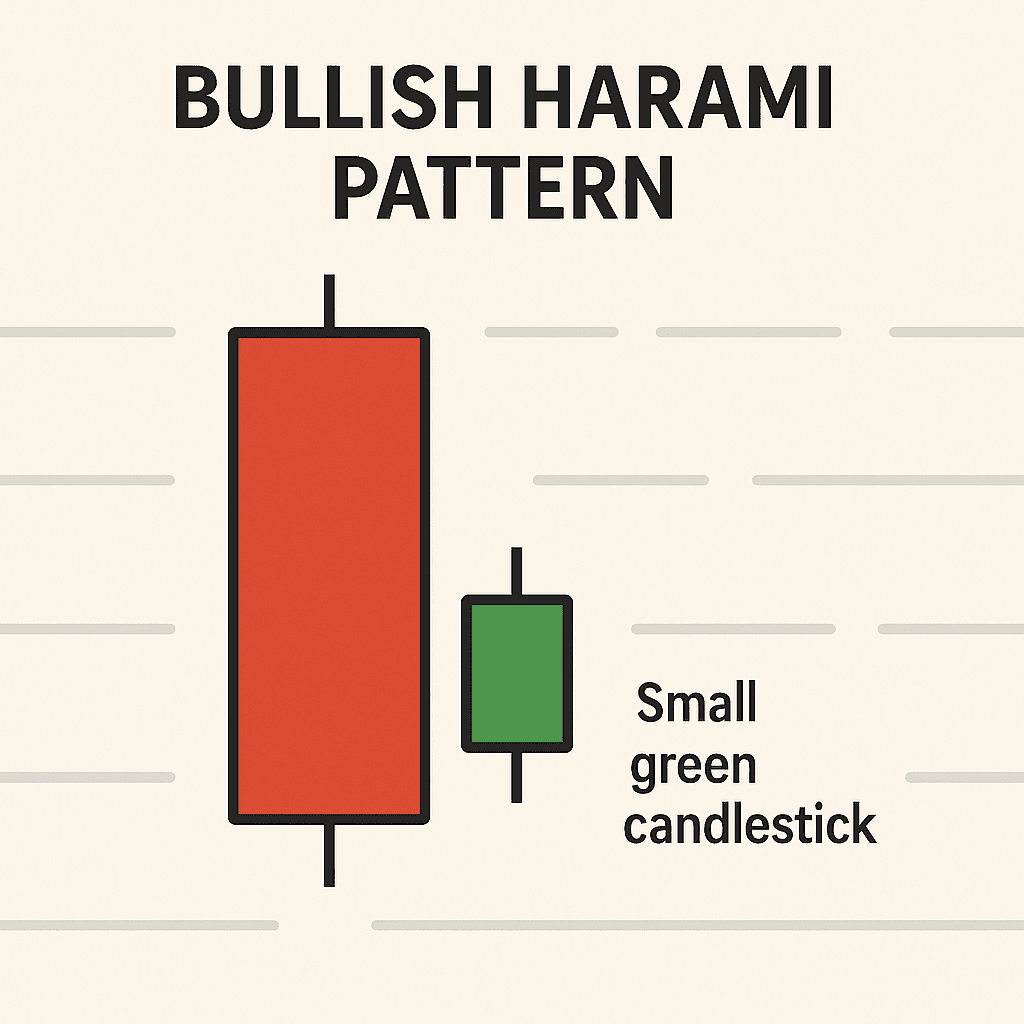
A small bullish candle within the body of a preceding large bearish candle, signaling weakening selling pressure.
What is the Bullish Harami Pattern?
The Bullish Harami pattern is a significant reversal signal in technical analysis, indicating potential price increases after a downtrend. This pattern consists of a small bullish candle nestled within a larger bearish candle, suggesting a shift in market sentiment.
What are the Key Takeaways of the Bullish Harami Pattern?
Reversal Signal: The Bullish Harami indicates a potential reversal in a downtrend, suggesting a shift in market sentiment.
Two-Candle Formation: It consists of a small bullish candle nestled within a larger bearish candle, highlighting indecision.
Confirmation Needed: Traders should seek confirmation through subsequent bullish candles before acting on the pattern.
Volume Consideration: Increased volume on the bullish candle enhances the reliability of the pattern.
Risk Management: Always implement stop-loss orders to mitigate potential losses when trading based on this pattern.
Looking to Dive Deeper into Candlestick Trading?
Download our complete Candlestick Pattern PDF — a handy reference covering 30+ patterns with visuals and trading strategies.
What is the Bullish Harami Pattern and How Can You Identify It?
Identifying the Bullish Harami Pattern can be relatively straightforward for traders familiar with candlestick formations. This pattern consists of two candles: a large bearish candle followed by a smaller bullish candle that is contained within the body of the first. The challenge lies in recognizing the context in which this pattern appears. Traders must consider market trends and volume to confirm its significance. A Bullish Harami is more reliable when it occurs after a downtrend, signaling potential reversals. With practice, spotting this pattern becomes easier. Utilizing charting tools and resources can enhance your ability to identify the Bullish Harami Pattern effectively, making it a valuable addition to your trading strategy.
What is the Importance of the Bullish Harami Pattern in Trading?
The Bullish Harami Pattern is crucial for traders as it signals potential reversals in a downtrend, indicating a shift in market sentiment. Recognizing this pattern can help investors make informed decisions, enhancing their profit potential. Additionally, it serves as a valuable tool for risk management, allowing traders to set stop-loss orders effectively. Overall, understanding this pattern can significantly improve trading strategies and outcomes.
What are the outcomes of the Bullish Harami Pattern based on its location?
At Support: Increased likelihood of a price reversal.
In an Uptrend: Potential continuation of the trend.
At Resistance: Caution advised; may indicate a temporary pullback.
What are the outcomes of the Bullish Harami Pattern based on its location?
At Support: Increased likelihood of a price reversal.
In an Uptrend: Potential continuation of the trend.
At Resistance: Caution advised; may indicate a temporary pullback.
What are the outcomes of the Bullish Harami Pattern based on its location?
At Support: Increased likelihood of a price reversal.
In an Uptrend: Potential continuation of the trend.
At Resistance: Caution advised; may indicate a temporary pullback.
What are the outcomes of the Bullish Harami Pattern based on its location?
At Support: Increased likelihood of a price reversal.
In an Uptrend: Potential continuation of the trend.
At Resistance: Caution advised; may indicate a temporary pullback.
How Does the Bullish Harami Pattern Compare to Its Opposite Pattern?
The Bullish Harami Pattern is a significant indicator in technical analysis, often signaling a potential reversal in a downtrend. In contrast, its opposite, the Bearish Harami Pattern, indicates a potential reversal in an uptrend. Here’s a concise comparison:
Aspect | Bullish Harami | Bearish Harami |
|---|---|---|
Market Context | Occurs in a downtrend | Occurs in an uptrend |
Candle Formation | Small bullish candle inside a larger bearish candle | Small bearish candle inside a larger bullish candle |
Implication | Potential reversal to bullish trend | Potential reversal to bearish trend |
Confirmation | Followed by a strong bullish candle | Followed by a strong bearish candle |
Trading Strategy | Buy on confirmation | Sell on confirmation |
In summary, while the Bullish Harami suggests a shift towards bullish sentiment, the Bearish Harami indicates a potential downturn. Traders should always look for confirmation before making trading decisions based on these patterns.
How Does the Bullish Harami Pattern Indicate a Price Reversal?
The Bullish Harami Pattern typically appears at the end of a downtrend, signaling potential price reversal. When a small bullish candle forms within the body of a preceding larger bearish candle, it suggests indecision among sellers. This shift in momentum can lead to increased buying interest, prompting a reversal. Traders often look for confirmation through subsequent bullish candles to validate the reversal signal and enter positions.
How Can Traders Effectively Use the Bullish Harami Pattern?
To leverage the Bullish Harami pattern, consider these key points:
Position in Trend: Identify if it appears after a downtrend for confirmation of reversal.
Volume Confirmation: Look for increased volume on the second candle to validate the pattern.
Support Levels: Ensure the pattern aligns with established support levels for stronger signals.
Risk Management: Set stop-loss orders below the pattern to mitigate potential losses.
By following these strategies, traders can enhance their decision-making when utilizing the Bullish Harami pattern.
What are the limitations of the Bullish Harami Pattern?
The Bullish Harami Pattern, while useful, has several limitations:
False Signals: It can produce misleading signals in volatile markets.
Confirmation Required: Traders often need additional indicators for validation.
Timeframe Sensitivity: Its effectiveness can vary across different timeframes.
Market Context: It may not perform well in strong downtrends.
Understanding these limitations is crucial for effective trading strategies.
Frequently Asked Questions about the Bullish Harami Pattern
1. How can I confirm a Bullish Harami pattern before making a trade?
To confirm a Bullish Harami pattern, look for additional indicators such as increased volume on the second candle, bullish divergence in momentum indicators, or a close above the high of the second candle. These confirmations can enhance the reliability of the pattern.
2. What timeframes are best for trading the Bullish Harami pattern?
The Bullish Harami pattern can be observed on various timeframes, but it is most effective on daily and weekly charts. Shorter timeframes may produce more noise, while longer timeframes tend to provide stronger signals.
3. Can the Bullish Harami pattern be used in conjunction with other trading strategies?
Yes, the Bullish Harami pattern can be effectively combined with other trading strategies, such as trend analysis, support and resistance levels, and moving averages, to enhance decision-making and risk management.
4. What are the common mistakes traders make when using the Bullish Harami pattern?
Common mistakes include ignoring confirmation signals, relying solely on the pattern without considering market context, and failing to set appropriate stop-loss orders. Traders should always incorporate risk management practices.
5. How does market sentiment affect the effectiveness of the Bullish Harami pattern?
Market sentiment plays a crucial role in the effectiveness of the Bullish Harami pattern. In a strongly bullish market, the pattern may lead to more reliable reversals, while in a bearish or uncertain market, the pattern may produce false signals. Always assess the broader market context.
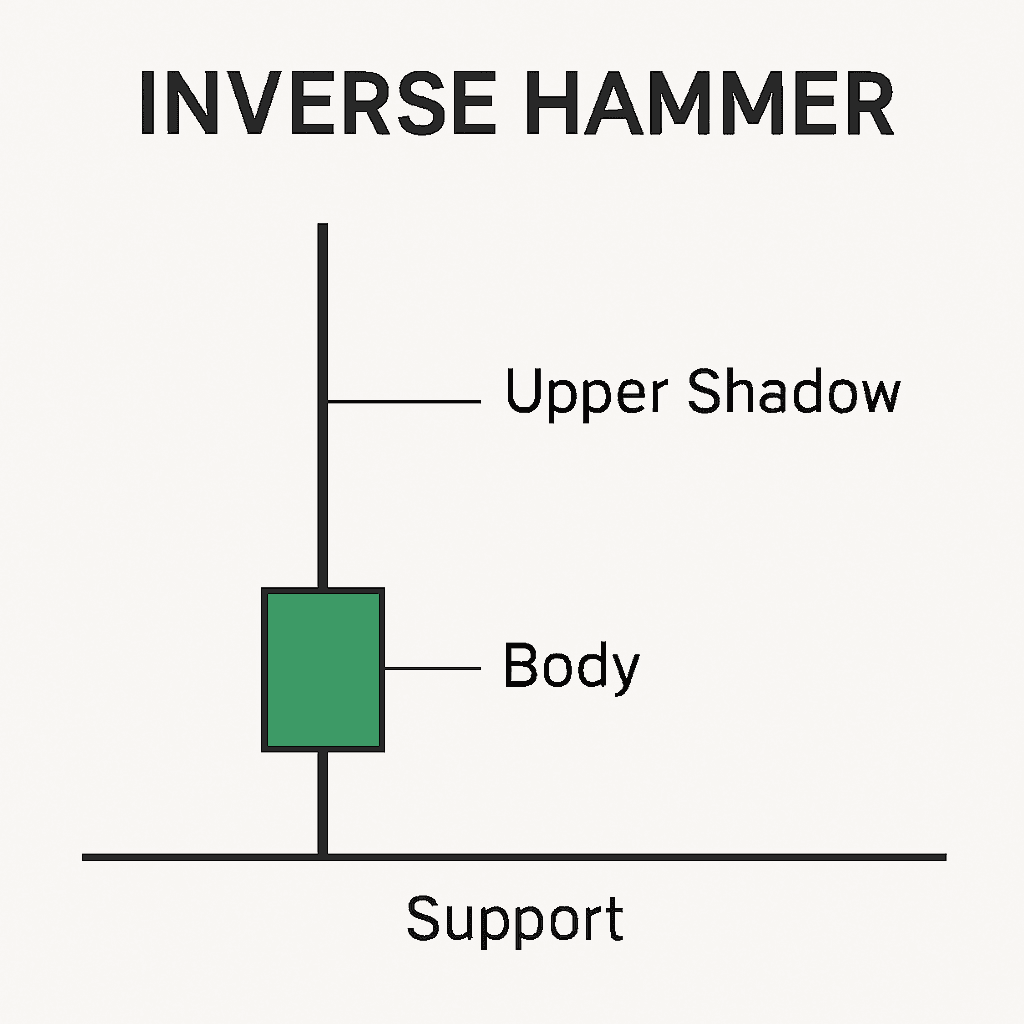
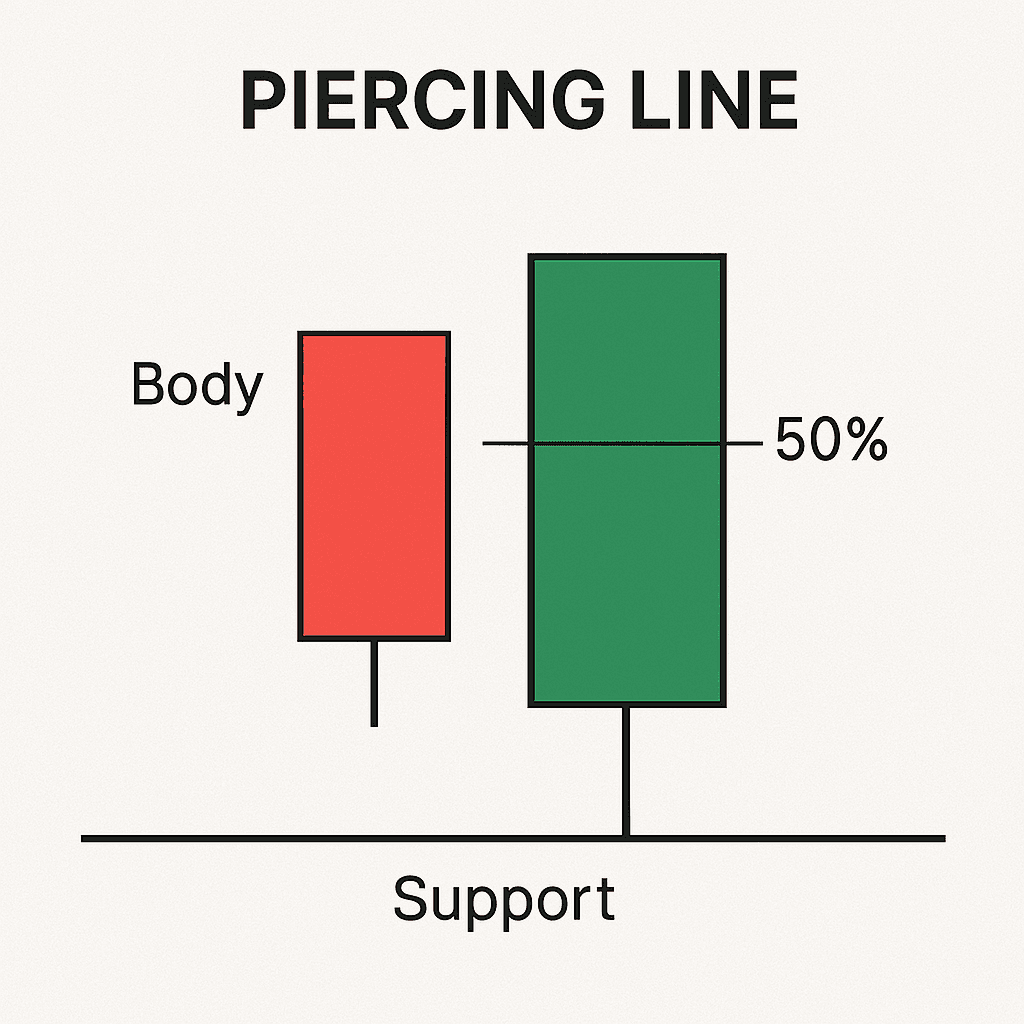
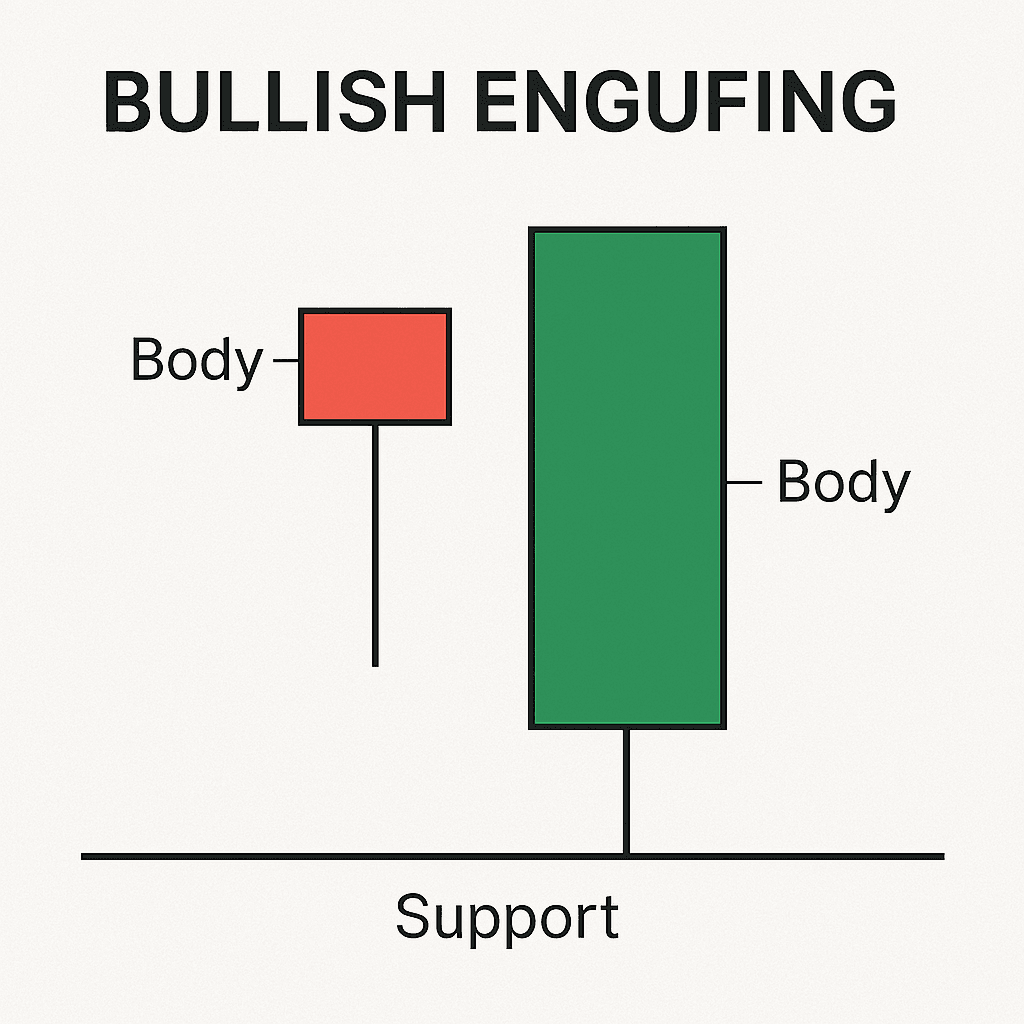
More Candle Stick Patterns


Research. Optimize. Dominate.
Confidently take control of your trades after understanding market sentiments.
Research. Optimize. Dominate.
Confidently take control of your trades after understanding market sentiments.
Research. Optimize. Dominate.
Confidently take control of your trades after understanding market sentiments.
Research. Optimize. Dominate.
Confidently take control of your trades after understanding market sentiments.