Bullish Reversal
Bullish Reversal
Bullish Reversal
Bullish Reversal
Piercing Line Pattern: What Investors Need to Know?

Finosauras
Team
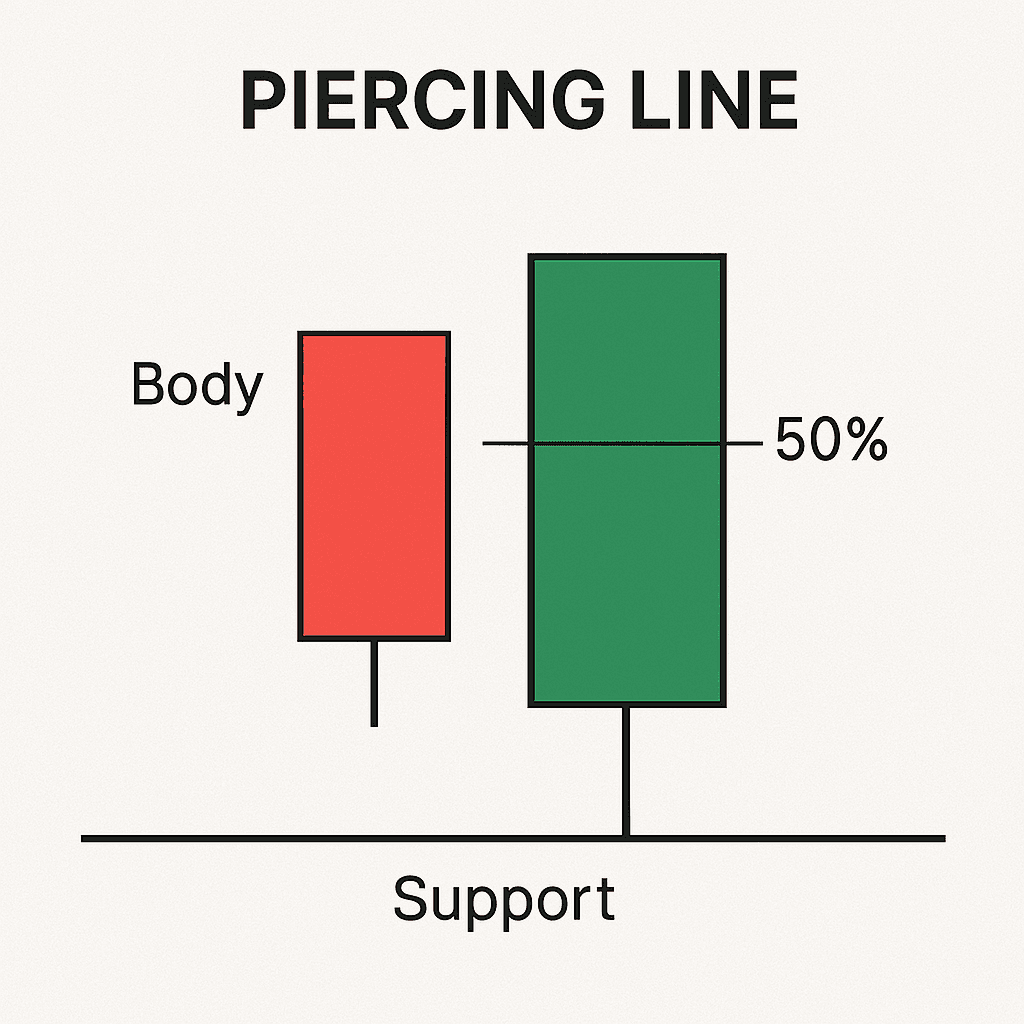
A Piercing Line Pattern is a bullish reversal signal characterized by a bearish candle followed by a bullish candle that opens below the previous day's low and closes above the midpoint of the bearish candle.
What is the Piercing Line Pattern?
The Piercing Line Pattern is a bullish reversal signal in candlestick charting, indicating a potential shift from a downtrend to an uptrend. This pattern forms when a bearish candle is followed by a bullish candle that opens lower but closes above the midpoint of the previous candle.
What Are the Key Takeaways of the Piercing Line Pattern?
The Piercing Line Pattern indicates a potential bullish reversal after a downtrend, signaling a shift in market sentiment.
Formation: It consists of two candles; a bearish candle followed by a bullish candle that opens lower and closes above the midpoint of the first candle.
Market Sentiment: This pattern reflects a shift from selling pressure to buying interest, suggesting increased bullish momentum.
Volume Confirmation: Higher trading volume during the formation enhances the reliability of the pattern, indicating stronger conviction among buyers.
Timeframe: It is most effective on daily or weekly charts, providing clearer signals for traders looking for reversal opportunities.
Risk Management: Traders should consider placing stop-loss orders below the low of the pattern to manage potential risks effectively.
Looking to Dive Deeper into Candlestick Trading?
Download our complete Candlestick Pattern PDF — a handy reference covering 30+ patterns with visuals and trading strategies.
What is the Piercing Line Pattern and How Can You Identify It?
Identifying the Piercing Line Pattern can be relatively straightforward for seasoned traders. This bullish reversal pattern occurs after a downtrend and consists of two candlesticks: a long bearish candle followed by a bullish candle that opens lower but closes above the midpoint of the first candle.
For beginners, recognizing this pattern may pose some challenges. It requires a keen eye for candlestick formations and an understanding of market context. However, with practice and the right tools, traders can improve their skills in spotting this pattern effectively.
Utilizing charting software can significantly enhance the identification process. By analyzing historical data and practicing with real-time charts, traders can gain confidence in recognizing the Piercing Line Pattern and making informed trading decisions.
What is the Importance of the Piercing Line Pattern in Trading?
The Piercing Line Pattern is crucial for traders as it signals potential bullish reversals, indicating a shift in market sentiment. Recognizing this pattern can help investors make informed decisions, optimize entry points, and manage risk effectively. Its reliability in forecasting price movements enhances trading strategies, making it a valuable tool for both novice and experienced traders.
What are the outcomes of the Piercing Line Pattern based on its location?
At Support: Bullish reversal, potential uptrend.
At Resistance: Weak signal, caution advised.
In a Downtrend: Stronger reversal indication.
In a Sideways Market: Uncertain outcomes, requires confirmation.
What are the outcomes of the Piercing Line Pattern based on its location?
At Support: Bullish reversal, potential uptrend.
At Resistance: Weak signal, caution advised.
In a Downtrend: Stronger reversal indication.
In a Sideways Market: Uncertain outcomes, requires confirmation.
What are the outcomes of the Piercing Line Pattern based on its location?
At Support: Bullish reversal, potential uptrend.
At Resistance: Weak signal, caution advised.
In a Downtrend: Stronger reversal indication.
In a Sideways Market: Uncertain outcomes, requires confirmation.
What are the outcomes of the Piercing Line Pattern based on its location?
At Support: Bullish reversal, potential uptrend.
At Resistance: Weak signal, caution advised.
In a Downtrend: Stronger reversal indication.
In a Sideways Market: Uncertain outcomes, requires confirmation.
How Does the Piercing Line Pattern Compare to Its Opposite Pattern?
Aspect | Piercing Line Pattern | Opposite Pattern (Dark Cloud Cover) |
|---|---|---|
Market Sentiment | Bullish reversal signal | Bearish reversal signal |
Formation | Occurs after a downtrend; first candle is bearish, second is bullish | Occurs after an uptrend; first candle is bullish, second is bearish |
Price Action | Second candle opens below the first candle's close and closes above the midpoint of the first candle | Second candle opens above the first candle's close and closes below the midpoint of the first candle |
Implication | Indicates potential trend reversal to bullish | Indicates potential trend reversal to bearish |
Volume Confirmation | Higher volume on the second candle strengthens the signal | Higher volume on the second candle strengthens the signal |
Trading Strategy | Consider entering long positions after confirmation | Consider entering short positions after confirmation |
How Does the Piercing Line Pattern Indicate a Price Reversal?
When the Piercing Line Pattern appears at the bottom of a downtrend, it signals a potential price reversal. This bullish pattern consists of two candles: a bearish candle followed by a bullish candle that opens lower but closes above the midpoint of the first candle. Its position at a support level enhances its reliability, indicating that buyers are stepping in, potentially reversing the downward momentum.
How Can Traders Effectively Use the Piercing Line Pattern in Their Strategies?
The Piercing Line Pattern signals potential bullish reversals. To leverage this pattern:
Identify Position: Look for the pattern at the bottom of a downtrend.
Confirm Volume: Ensure increased trading volume on the second candle.
Set Entry Points: Enter trades above the high of the second candle.
Manage Risk: Place stop-loss orders below the low of the pattern.
Utilizing these strategies can enhance your trading effectiveness with the Piercing Line Pattern.
What are the limitations of the Piercing Line Pattern?
The Piercing Line Pattern, while useful, has several limitations:
False Signals: It can produce misleading signals, especially in volatile markets.
Confirmation Needed: Traders often require additional confirmation from other indicators.
Market Context: Its effectiveness can vary based on market conditions and trends.
Timeframe Sensitivity: Results may differ across various timeframes.
Understanding these limitations is crucial for effective trading strategies.
Frequently Asked Questions About the Piercing Line Pattern
1. How reliable is the Piercing Line Pattern for predicting market reversals?
The reliability of the Piercing Line Pattern can vary based on market conditions and the context in which it appears. Generally, it is considered a strong bullish reversal signal, especially when confirmed by high trading volume and other technical indicators.
2. What timeframes are best for trading the Piercing Line Pattern?
The Piercing Line Pattern can be observed on various timeframes, but it is most effective on daily and weekly charts. Shorter timeframes may produce more false signals, while longer timeframes tend to provide more reliable patterns.
3. Can the Piercing Line Pattern be used in conjunction with other technical indicators?
Yes, combining the Piercing Line Pattern with other technical indicators, such as moving averages or RSI, can enhance its effectiveness. This multi-faceted approach helps confirm the reversal signal and reduces the likelihood of false positives.
4. What are the common mistakes traders make when using the Piercing Line Pattern?
Common mistakes include ignoring the overall market trend, failing to wait for confirmation, and not considering the volume associated with the pattern. Traders should also avoid relying solely on this pattern without additional analysis.
5. How can I manage risk when trading the Piercing Line Pattern?
To manage risk, traders should set stop-loss orders just below the low of the Piercing Line Pattern. Additionally, position sizing and diversifying trades can help mitigate potential losses while taking advantage of the bullish signal.
More Candle Stick Patterns


Research. Optimize. Dominate.
Confidently take control of your trades after understanding market sentiments.
Research. Optimize. Dominate.
Confidently take control of your trades after understanding market sentiments.
Research. Optimize. Dominate.
Confidently take control of your trades after understanding market sentiments.
Research. Optimize. Dominate.
Confidently take control of your trades after understanding market sentiments.